Interactive Operations Research
 

Mission

To Enhance Decision-Making Using Interactive ML and OR-Driven Web-based Tools!

What is a Tool?

Tools are user-friendly web applications designed to support planning and operations through interactive data and model-driven analysis. They allow users to adjust inputs, explore scenarios, and receive real-time feedback. Tools are built to be intuitive, cloud-based, and accessible to a wide range of users.


Tools VS Dashboards

Tools are often confused with dashboards, but they serve different purposes. Dashboards focus on historical data and descriptive analytics to help users understand past and current trends. In contrast, tools not only visualize and manipulate data but also support “what-if” scenario analysis using predictive and prescriptive analytics, enabling deeper exploration and decision-making.

Beyond Arc-GIS, Tableau, and Power-BI !


What is Operations Research (OR)?

Operations research (OR) is a field of mathematics that uses analytical methods for better decision-making. Despite its long life since its birth at the Second World War, the field has advanced further on “Research” than “Operations.”

What is Machine Learning (ML)?

Machine Learning (ML) is a branch of artificial intelligence that enables systems to learn patterns from data and improve performance without being explicitly programmed. While ML has seen rapid growth in recent years, its applications often remain limited to academic or highly specialized settings.


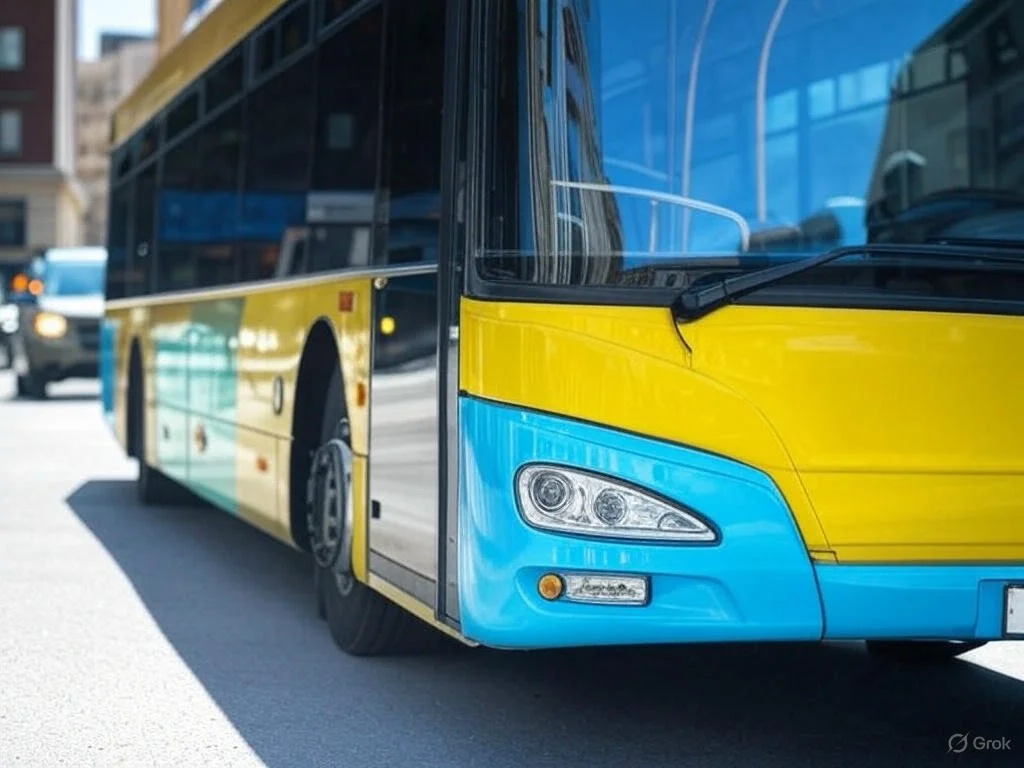
Interactive design in public transportation improves how systems are planned and managed by making data more accessible and actionable. Real-time tools help detect issues like bus bunching and visualize transit patterns through animations and heatmaps. Predictive models smooth out delays in data feeds, making real-time movement easier to interpret. Interactive platforms also support network design and fleet electrification, allowing planners to test scenarios, adjust routes, and optimize resources.

Network Design

  1. 4-Step Model: Implements trip generation, distribution, and assignment.

  2. GTFS Integration: Supports editing of routes, blocks, and trips.

  3. Adjustable Parameters: Allows changes to stop locations and headways.

  4. Congestion Visualization: Line thickness reflects network load.


Real-Time monitoring

  1. Real-Time Animation: Predicts bus positions between GTFS-RT updates for smooth display.

  2. Bunching Detection: Identifies bunching using static and real-time GTFS data.

  3. Heatmap Display: Shows bunching intensity over 5–30 minute intervals.

  4. Upcoming Feature: Incorporation of crowding data for service adjustments.


Transit Electrification

Interactive Planning Tool: Configure charger locations, capacities, and electric bus specs.

GTFS Integration: Generates optimal charging plans using GTFS schedule data.

Smart Scheduling: Accounts for layovers, charge continuity, and operational limits.

Custom Fleet Design: Supports flexible fleet sizing and composition.


Interactive design in micromobility enhances planning by turning complex data into actionable insights for bikeshare systems. Tools like Bikeshare Pro enable data-driven station placement, demand forecasting, and performance evaluation using models trained on data from multiple cities. Interactive features support real-time rebalancing, helping identify surplus and deficit stations and optimize bike relocation strategies. The platform also includes tools for e-bike planning, cost analysis, and transit integration, allowing planners to simulate scenarios, refine designs, and improve service delivery in a flexible and responsive environment.


Expansion Planning

  1. Data-Driven Design: Plans networks in new cities using models trained on data from 12 existing systems.

  2. Ridership Prediction: Uses ML models to forecast demand based on local context.

  3. Station Optimization: Suggests station locations based on ridership, equity, and access goals.

  4. Performance Insights: Analyzes availability, relocation needs, and cost/revenue trends.


Real-Time Re-balancing

  1. Rebalancing Optimization: Solves a pickup and delivery problem to redistribute bikes between surplus and deficit stations.

  2. Live System Data: Uses real-time data from Bikeshare Toronto to monitor station availability.

  3. Policy Control: Allows adjustment of thresholds for minimum/maximum bikes and prioritizes key stations.

  4. Custom Fleet Settings: Supports truck capacity inputs; multi-vehicle extension in progress.

Winter Maintenance Planning and Operations

  1. Optimized Routing: Plans efficient plow and salt routes using arc-routing algorithms.

  2. Scenario Analysis: Tests zone, depot, and service-level changes in real time.

  3. LOS Monitoring: Tracks clearance time compliance across all road types.

  4. Interactive Tools: Allows live edits to zones and depots with instant updates.


Emergency Management

  1. Scenario Planning: Test station placements and coverage in real time.

  2. Response Analytics: Analyze call trends and performance metrics.

  3. Coverage Tools: Visualize and adjust response time zones.

  4. Location Optimization: Suggest better station placements using demand data.

  5. Performance Dashboard: Monitor system and station-level KPIs live.


Data-Driven Parking Pricing

  1. Smart Forecasting: Predicts occupancy using parking transaction data and GNN models.

  2. Pricing Simulator: Tests hourly, time-of-day, and progressive pricing strategies.

  3. Sensor-Free Data: Leverages widely available payment data over costly infrastructure.

  4. Mapped Zones: Uses geocoded Green-P zones for spatial pricing analysis.


Drone Delivery Routing

  1. Coordinated Routing: Optimizes delivery time by synchronizing truck and drone trajectories.

  2. Customizable Fleet: Adjusts drone range, speed, and fleet size interactively.

  3. Interactive Planning: Provides a visual interface for scenario testing and route updates.

  4. Future Features: Will support multi-truck routing, no-fly zones, 3D navigation, and onboard charging.


Two-Echelon Vehicle Routing

  1. Two-Stage Delivery: Optimizes routes from depot to customers via intermediate satellites.

  2. Multi-Modal Routing: Supports combinations like driving + walking, cycling, or transit.

  3. Custom Fleet Settings: Adjusts capacity and size of last-mile delivery fleet.

  4. Efficient Algorithm: Minimizes total delivery time using real routing data.


Region Partitioning

  1. Demand-Based Zones: Splits regions by demand, fleet size, and capacity.

  2. Adaptive Sizing: Regions shrink in dense areas, expand in sparse ones.

  3. Depot-Driven Layout: Zones update based on depot location.

If you have a cool tool idea, we have develop it together. We follow an agile project management strategy aiming for the Minimum Viable Product (MVP), which keeps the development process lean and fast. The process starts with receiving a high level scope from you explaining the desired objectives, functions, available data, etc. Visuals and details are great. We convert the high level scope into a proposal to be reviewed by you.


Contact Us


Contact us below if you have a tool idea to share or would like to have a demo of one of the existing ones!